Senin, 01 Juni 2015

Technical Analysis: The Use Of Trend

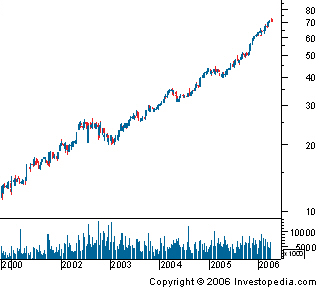
One of the most important concepts in technical analysis is that of trend. The meaning in finance isn't all that different from the general definition of the term - a trend is really nothing more than the general direction in which a security or market is headed. Take a look at the chart below:
Uptrend.gif
Figure 1
It isn't hard to see that the trend in Figure 1 is up. However, it's not always this easy to see a trend:
NoTrend.gif
Figure 2
There are lots of ups and downs in this chart, but there isn't a clear indication of which direction this security is headed.
A More Formal Definition
Unfortunately, trends are not always easy to see. In other words, defining a trend goes well beyond the obvious. In any given chart, you will probably notice that prices do not tend to move in a straight line in any direction, but rather in a series of highs and lows. In technical analysis, it is the movement of the highs and lows that constitutes a trend. For example, an uptrend is classified as a series of higher highs and higher lows, while a downtrend is one of lower lows and lower highs.
uptrendnumbers.gif
Figure 3
Figure 3 is an example of an uptrend. Point 2 in the chart is the first high, which is determined after the price falls from this point. Point 3 is the low that is established as the price falls from the high. For this to remain an uptrend, each successive low must not fall below the previous lowest point or the trend is deemed a reversal.
Types of Trend
There are three types of trend:
Sideways/Horizontal Trends As the names imply, when each successive peak and trough is higher, it's referred to as an upward trend. If the peaks and troughs are getting lower, it's a downtrend. When there is little movement up or down in the peaks and troughs, it's a sideways or horizontal trend. If you want to get really technical, you might even say that a sideways trend is actually not a trend on its own, but a lack of a well-defined trend in either direction. In any case, the market can really only trend in these three ways: up, down or nowhere. (For more insight, see Peak-And-Trough Analysis.)
Trend Lengths
Along with these three trend directions, there are three trend classifications. A trend of any direction can be classified as a long-term trend, intermediate trend or a short-term trend. In terms of the stock market, a major trend is generally categorized as one lasting longer than a year. An intermediate trend is considered to last between one and three months and a near-term trend is anything less than a month. A long-term trend is composed of several intermediate trends, which often move against the direction of the major trend. If the major trend is upward and there is a downward correction in price movement followed by a continuation of the uptrend, the correction is considered to be an intermediate trend. The short-term trends are components of both major and intermediate trends. Take a look a Figure 4 to get a sense of how these three trend lengths might look.
TrendLength.gif
Figure 4
When analyzing trends, it is important that the chart is constructed to best reflect the type of trend being analyzed. To help identify long-term trends, weekly charts or daily charts spanning a five-year period are used by chartists to get a better idea of the long-term trend. Daily data charts are best used when analyzing both intermediate and short-term trends. It is also important to remember that the longer the trend, the more important it is; for example, a one-month trend is not as significant as a five-year trend. (To read more, see Short-, Intermediate- And Long-Term Trends.)
Trendlines
trendline is a simple charting technique that adds a line to a chart to represent the trend in the market or a stock. Drawing a trendline is as simple as drawing a straight line that follows a general trend. These lines are used to clearly show the trend and are also used in the identification of trend reversals. As you can see in Figure 5, an upward trendline is drawn at the lows of an upward trend. This line represents the support the stock has every time it moves from a high to a low. Notice how the price is propped up by this support. This type of trendline helps traders to anticipate the point at which a stock's price will begin moving upwards again. Similarly, a downward trendline is drawn at the highs of the downward trend. This line represents the resistance level that a stock faces every time the price moves from a low to a high. (To read more, see Support & Resistance Basics and Support And Resistance Zones - Part 1 and Part 2.)
AscendingTrendline.gif
Figure 5
Channels
channel, or channel lines, is the addition of two parallel trendlines that act as strong areas of support and resistance. The upper trendline connects a series of highs, while the lower trendline connects a series of lows. A channel can slope upwarddownward or sideways but, regardless of the direction, the interpretation remains the same. Traders will expect a given security to trade between the two levels of support and resistance until it breaks beyond one of the levels, in which case traders can expect a sharp move in the direction of the break. Along with clearly displaying the trend, channels are mainly used to illustrate important areas of support and resistance.
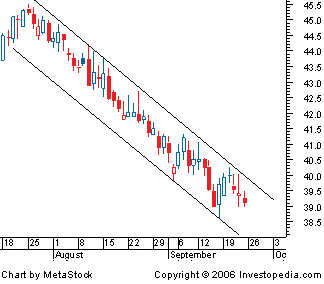
DownwardChannel.gif
Figure 6
Figure 6 illustrates a descending channel on a stock chart; the upper trendline has been placed on the highs and the lower trendline is on the lows. The price has bounced off of these lines several times, and has remained range-bound for several months. As long as the price does not fall below the lower line or move beyond the upper resistance, the range-bound downtrend is expected to continue.
The Importance of Trend
It is important to be able to understand and identify trends so that you can trade with rather than against them. Two important sayings in technical analysis are "the trend is your friend" and "don't buck the trend," illustrating how important trend analysis is for technical traders.


Read more: Technical Analysis: The Use Of Trend | Investopedia http://www.investopedia.com/university/technical/techanalysis3.asp#ixzz3k5IN1aD6 
Follow us: Investopedia on Facebook

Rabu, 27 Mei 2015

What Is Market Efficiency?

When money is put into the stock market, the goal is to generate a return on the capital invested. Many investors try not only to make a profitable return, but also to outperform, or beat, the market.
However, market efficiency - championed in the efficient market hypothesis (EMH) formulated by Eugene Fama in 1970, suggests that at any given time, prices fully reflect all available information on a particular stock and/or market. Fama was awarded the Nobel Memorial Prize in Economic Sciences jointly with Robert Shiller and Lars Peter Hansen in 2013. According to the EMH, no investor has an advantage in predicting a return on a stock price because no one has access to information not already available to everyone else.
The Effect of Efficiency: Non-Predictability
The nature of information does not have to be limited to financial news and research alone; indeed, information about political, economic and social events, combined with how investors perceive such information, whether true or rumored, will be reflected in the stock price. According to the EMH, as prices respond only to information available in the market, and because all market participants are privy to the same information, no one will have the ability to out-profit anyone else.
In efficient markets, prices become not predictable but random, so no investment pattern can be discerned. A planned approach to investment, therefore, cannot be successful.
This "random walk" of prices, commonly spoken about in the EMH school of thought, results in the failure of any investment strategy that aims to beat the market consistently. In fact, the EMH suggests that given the transaction costs involved in portfolio management, it would be more profitable for an investor to put his or her money into an index fund.
Anomalies: The Challenge to Efficiency
In the real world of investment, however, there are obvious arguments against the EMH. There are investors who have beaten the market - Warren Buffett, whose investment strategy focuses on undervalued stocks, made billions and set an example for numerous followers. There are portfolio managers who have better track records than others, and there are investment houses with more renowned research analysis than others. So how can performance be random when people are clearly profiting from and beating the market?
Counter arguments to the EMH state that consistent patterns are present. For example, the January effect is a pattern that shows higher returns tend to be earned in the first month of the year; and the weekend effect is the tendency for stock returns on Monday to be lower than those of the immediately preceding Friday.
Studies in behavioral finance, which look into the effects of investor psychology on stock prices, also reveal that investors are subject to many biases such as confirmation, loss-aversion and overconfidence biases.
The EMH Response
The EMH does not dismiss the possibility of market anomalies that result in generating superior profits. In fact, market efficiency does not require prices to be equal to fair value all the time. Prices may be over- or undervalued only in random occurrences, so they eventually revert back to their mean values. As such, because the deviations from a stock's fair price are in themselves random, investment strategies that result in beating the market cannot be consistent phenomena.
Furthermore, the hypothesis argues that an investor who outperforms the market does so not out of skill but out of luck. EMH followers say this is due to the laws of probability: at any given time in a market with a large number of investors, some will outperform while others will underperform.
How Does a Market Become Efficient?
For a market to become efficient, investors must perceive that the market is inefficient and possible to beat. Ironically, investment strategies intended to take advantage of inefficiencies are actually the fuel that keeps a market efficient.
A market has to be large and liquid. Accessibility and cost information must be widely available and released to investors at more or less the same time. Transaction costs have to be cheaper than an investment strategy's expected profits. Investors must also have enough funds to take advantage of inefficiency until, according to the EMH, it disappears again.
Degrees of Efficiency
Accepting the EMH in its purest form may be difficult; however, three identified EMH classifications aim to reflect the degree to which it can be applied to markets:
1. Strong efficiency - This is the strongest version, which states that all information in a market, whether public or private, is accounted for in a stock price. Not even insider information could give an investor an advantage.
2. Semi-strong efficiency - This form of EMH implies that all public information is calculated into a stock's current share price. Neither fundamental nor technical analysis can be used to achieve superior gains.
3. Weak efficiency - This type of EMH claims that all past prices of a stock are reflected in today's stock price. Therefore, technical analysis cannot be used to predict and beat a market.
The Bottom Line
In the real world, markets cannot be absolutely efficient or wholly inefficient. It might be reasonable to see markets as essentially a mixture of both, wherein daily decisions and events cannot always be reflected immediately into a market. If all participants were to believe that the market is efficient, no one would seek extraordinary profits, which is the force that keeps the wheels of the market turning.
In the age of information technology (IT), however, markets all over the world are gaining greater efficiency. IT allows for a more effective, faster means to disseminate information, and electronic trading allows for prices to adjust more quickly to news entering the market. However, while the pace at which we receive information and make transactions quickens, IT also restricts the time it takes to verify the information used to make a trade. Thus, IT may inadvertently result in less efficiency if the quality of the information we use no longer allows us to make profit-generating decisions.

Securely trade FX, stock indices and commodities
London Capital Group offers multiple products allowing you to trade FX, stock indices and commodities. Features low spreads, is LSE listed and offers advanced, secure MT4 trading platform and 24hr support. Losses can exceed deposits. Click here to join now.


Read more: What Is Market Efficiency? http://www.investopedia.com/articles/02/101502.asp#ixzz3k5HeiP9a 
Follow us: Investopedia on Facebook